This has been a year like no other, the effects of Covid-19 have impacted us all on personal and professional levels. In the first part of the year, I was looking at booking behaviors and worrying about the impacts to travel in Asia. By the end of March, I found myself obsessively checking Covid-19 statistics multiple times a day in fear and fascination. I was starting to worry less about travel in Asia and more about my health, my family, my job, my retirement and whether grocery stores were going to run out of food.
After a scary and uncertain few months, as some countries start to reopen and death rates improve in much of the world, I’ve been reflecting on how Covid has impacted the data and BI industry. There’s no doubt the effects will last for years to come.
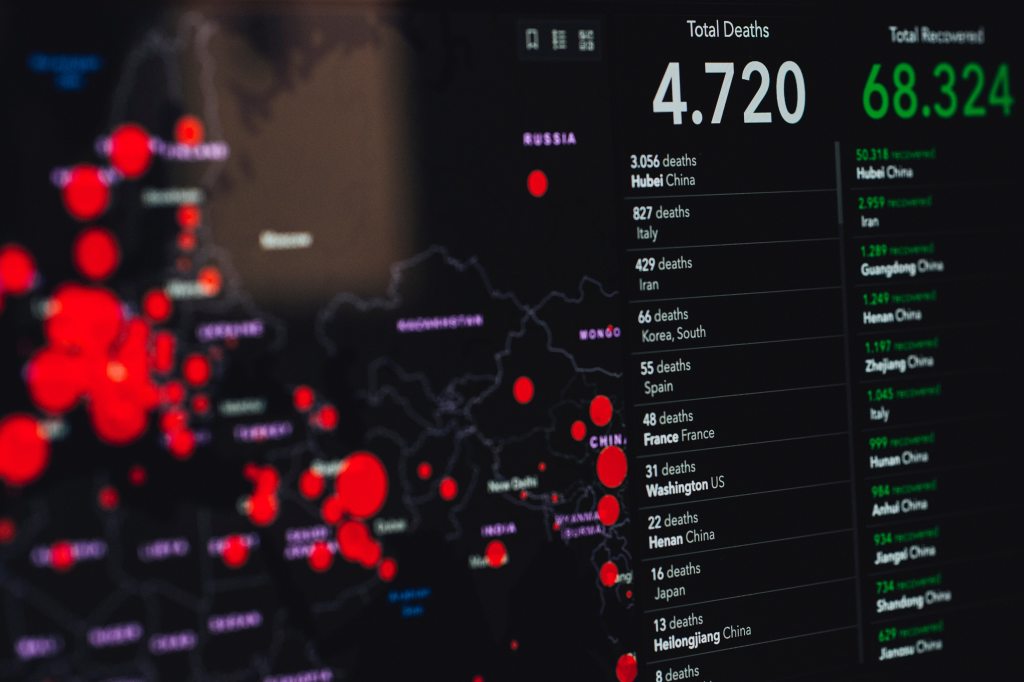
One of the impacts that I find most obvious is that the world has become more data literate. Data literacy, according to Wikipedia, is “the ability to read, work with, analyze, and argue with data.” When Covid-19 first started appearing in the headlines, the discussions were focused on the origin of the virus and the impacts to China specifically. Charts and graphs weren’t very common as the main reporting was about the origins of the virus, high level numbers about infections and deaths and plans to evacuate non-residents people from the area. I saw a few maps showing the affected areas but they were limited.
As the virus spread and we went into lockdown, charts and graphs became part of our everyday reporting. News channels showed more and more statistics in their reporting and my conversations with friends and family and coworkers inevitably resulted in one of us mentioning statistics we’d seen or sharing links to sites with numbers about the virus and its impact.
One of the sites I’ve used most is Worldometer. I’ve read some criticisms of Worldometer’s transparency about their data sources and I can’t vouch for how accurate its numbers are, but Covid-19 has caused the site to go from relative obscurity to becoming # 75 in the Alexa rankings. The site’s popularity I assume is because of its simplicity – they don’t seem to invest much in advanced analysis but what they have is easy to digest and easy to navigate.
For more granular information on a specific US location, a friend of mine shared a CNN site. I live in the UK right now so the site doesn’t help me for my area, but I like that I can see how the virus is specifically impacting my friends and family back in the US.
As we’ve gotten more used to numbers and statistics, data literacy begins to show itself in subtle ways:
- Data science terms such as ‘flatten the curve’ have now become mainstream and used in everyday discussions. It’s a very complex topic to try to cover in a news report and I don’t know how many people understand it fully but it has become a common term in Covid coverage.
- Our collective ability to digest charts and graphs has improved. How many times have you seen news commentators or friends picking apart a chart and questioning how gaps in data may affect the numbers?
- Data biases are more openly discussed. One particular bias I find fascinating is that early indications in China showed that more men than women were dying from Coronavirus. Further research suggested this may be caused by smoking habits – 52% of men in China smoke but less than 3% of women do.
- One writer coined a new term ‘infowhelm’ to describe the overwhelming (and often contradictory) information we receive from various sources.
- Shanon’s last blog on catfishing calls out the importance of reporting the numbers accurately and with transparency. This doesn’t always happen so it is often on us as consumers to ensure we understand what we’re seeing.
Do you have a favorite site for Covid-19 information and statistics? Have you seen other signs of improved data literacy?

Leave a comment